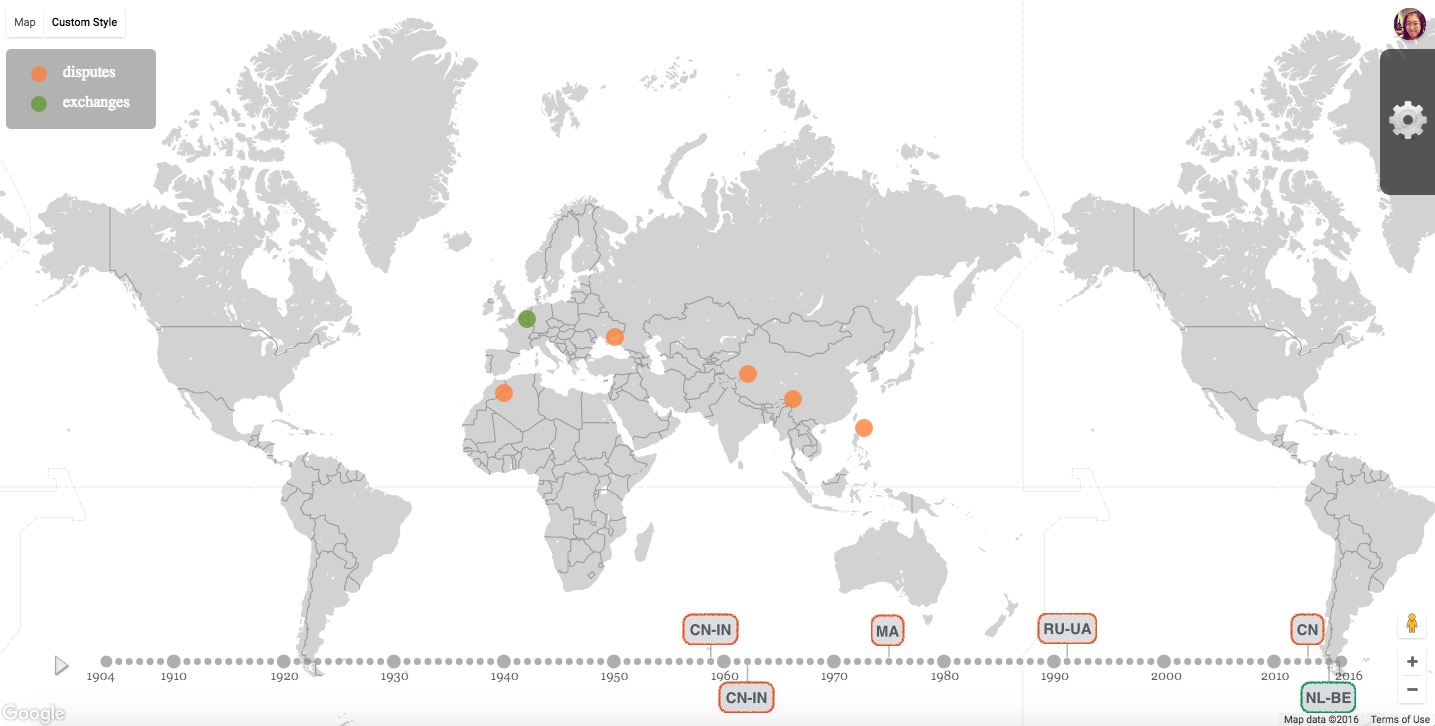
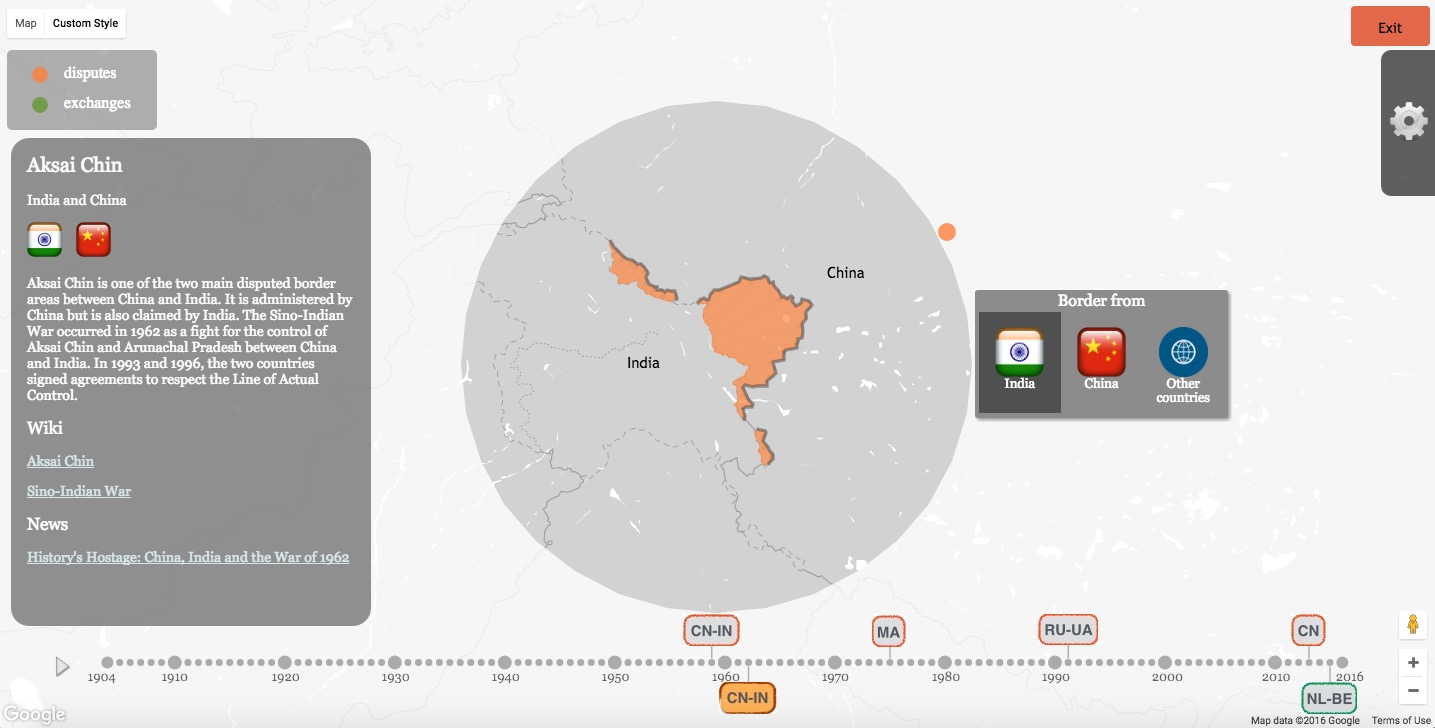
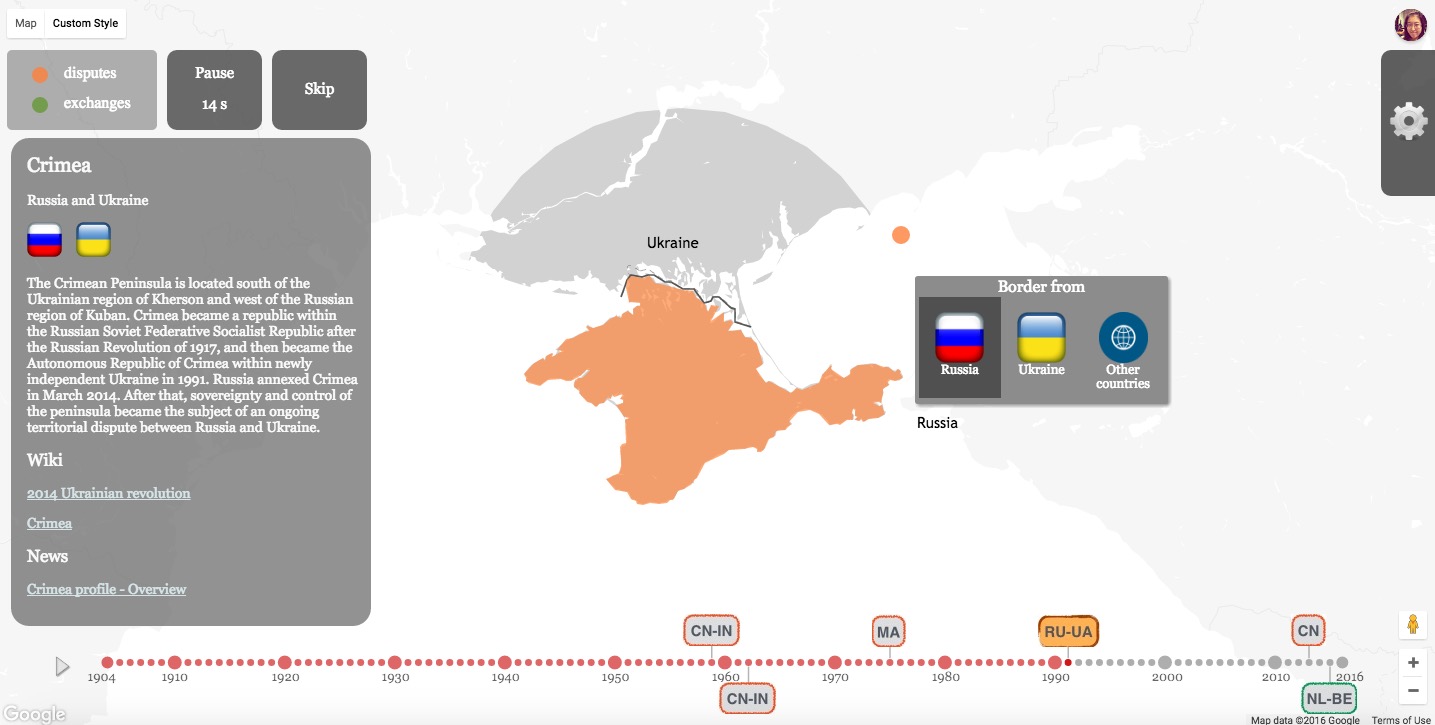
Disputes and changes of international borders have been an area of study for cartographers since long ago. Now, with online maps growing faster than printed maps, the task also transfers to online map creators. Companies like Google and Bing provide personalized maps where disputed international borders are in compliance with national laws based on the users' location. Knowing these disputes, the presentation of the differences of international borders between countries as well as on geographical time is an unexplored topic in visualization. In this paper, we propose a fluid visualization method on displaying temporal border changes. We build a tool, Borders, with such fluid visualization to present border events (border disputes and land delivery) and the history of them. In Borders, there are three views, namely general view, detail view, and timeline view, focusing on different aspects of the border events and supporting user exploration of the background knowledge. To provide better learning and comprehension of the border events, contextual cues of border events are integrated in the interface explaining the causes and evolution of events.