Fixed Dimensions
Images with fixed dimensions
images/35x35/1.jpg
-
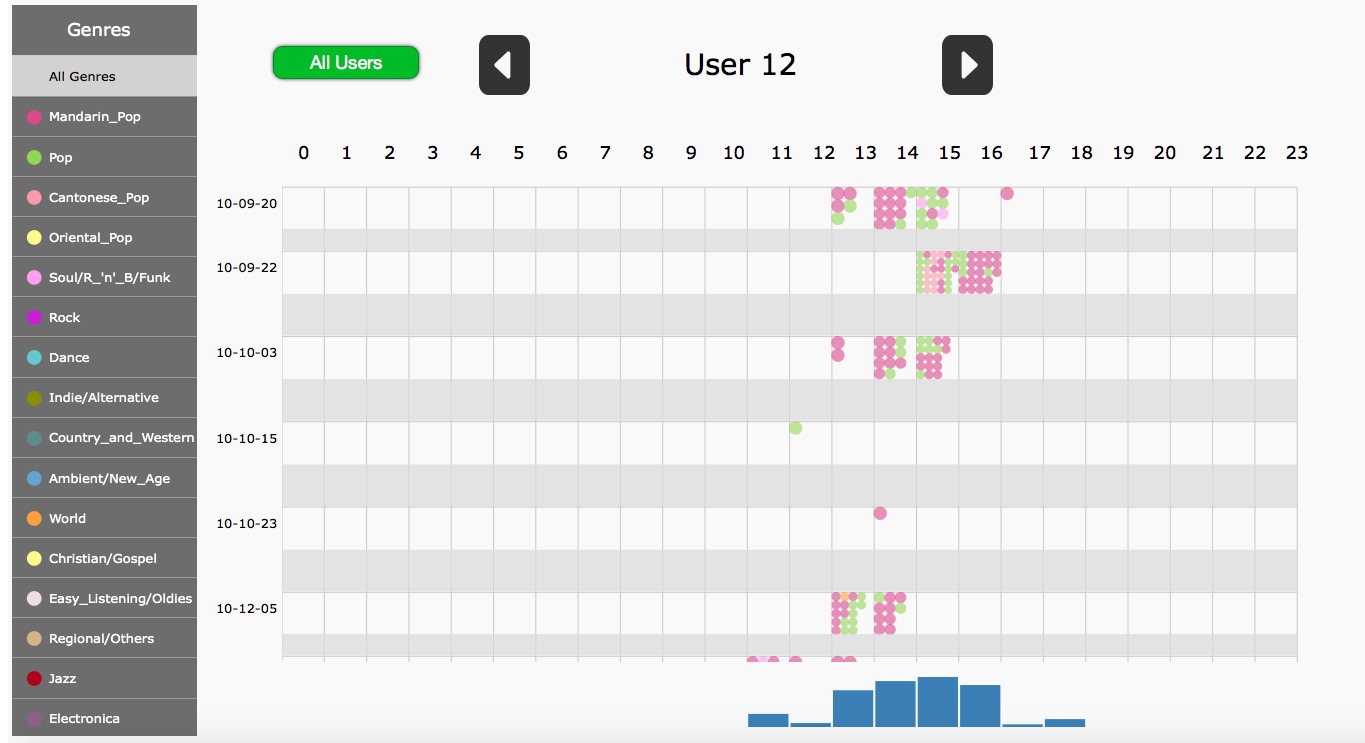
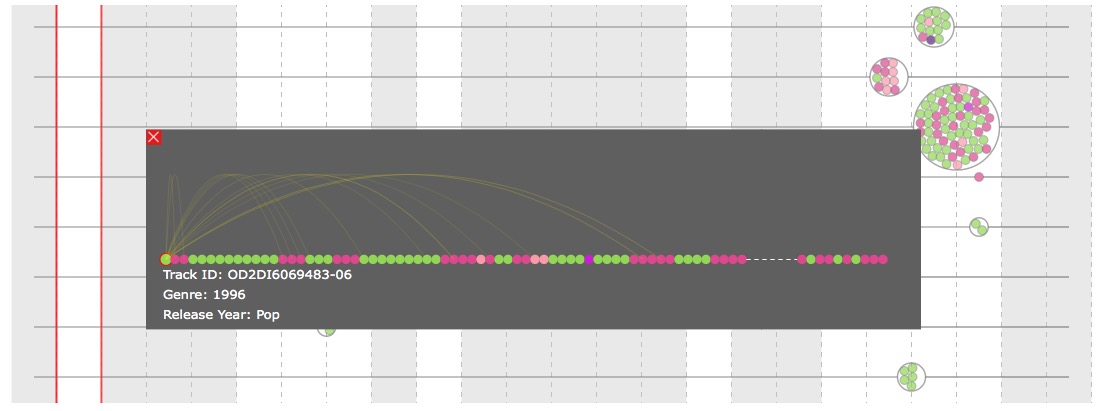
Visualize User's Listening History by Session
With Bean Plot Combined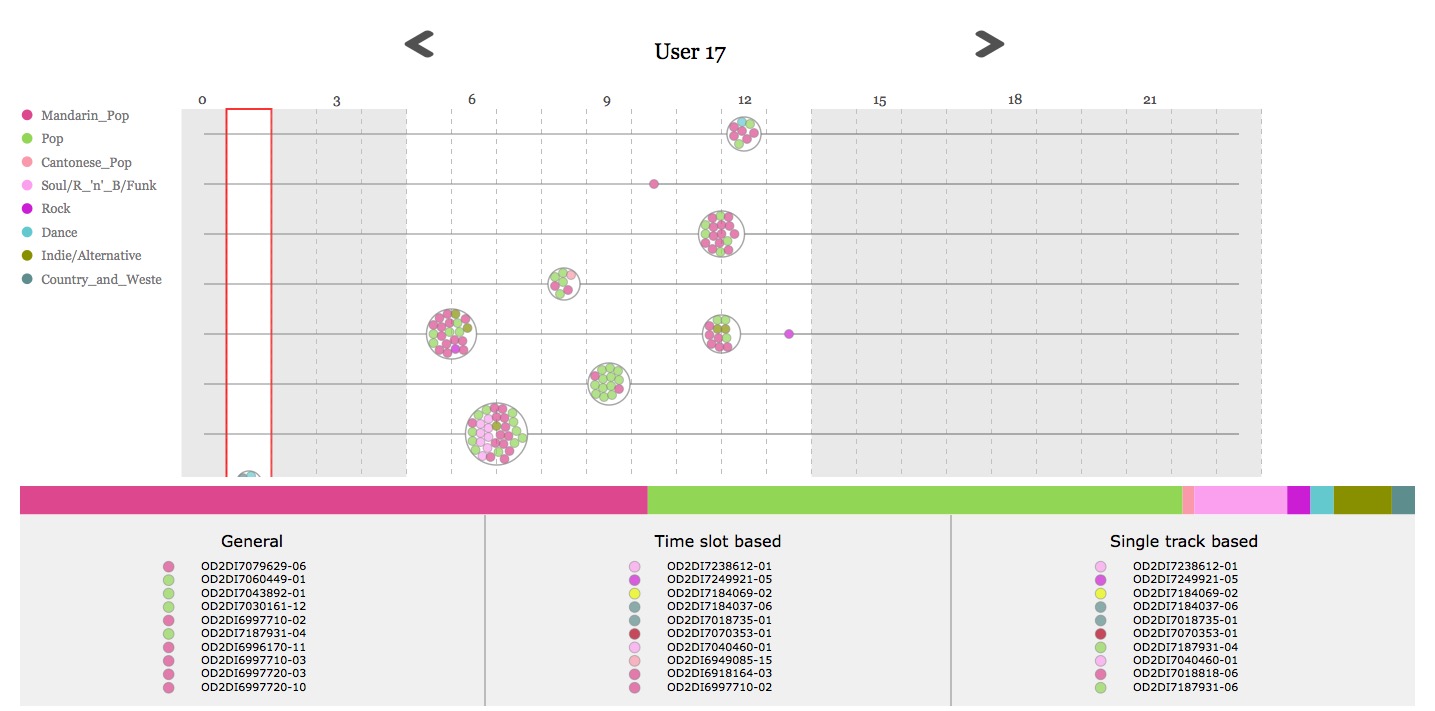
-
An extended pod (session)
-
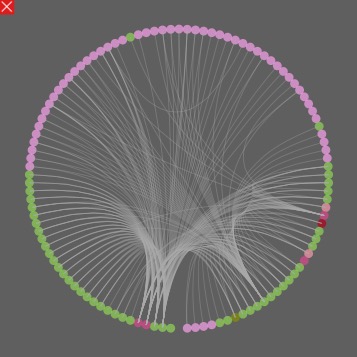
Collaborative Relevance in a Session

-
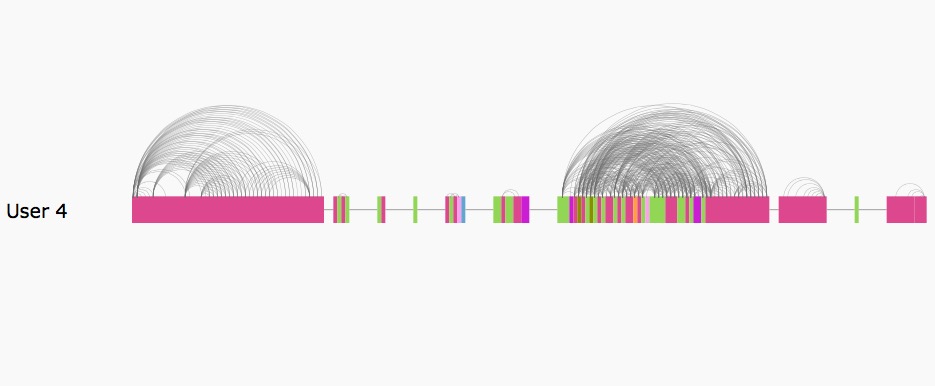
Another Form of Bean Plot

-
Visualize User's Listening History by Session