Fixed Dimensions
Images with fixed dimensions
images/35x35/1.jpg
-
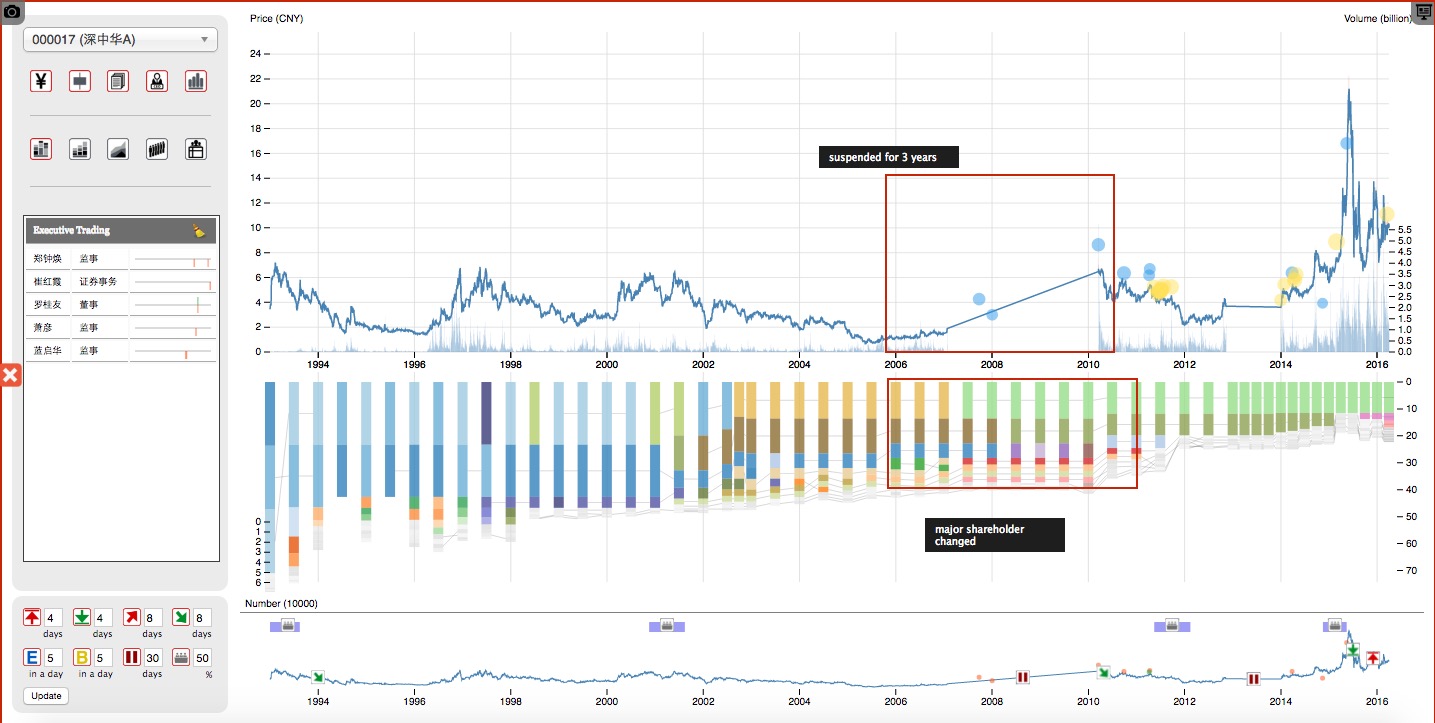
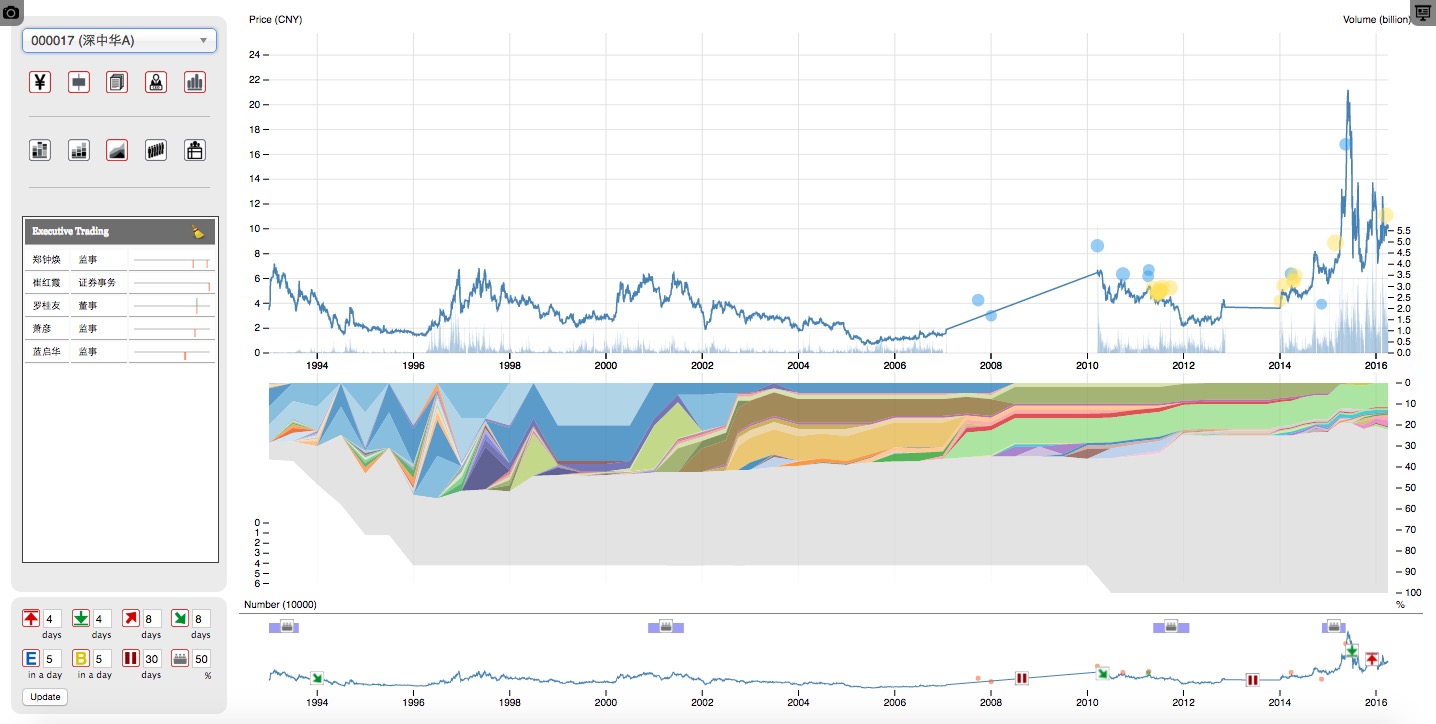
StockVis interface - control panel on the left; upper canvas on right presents stock price, volume, and other trading information; middle one shows shareholder changes; timeline presented in lower one.
-
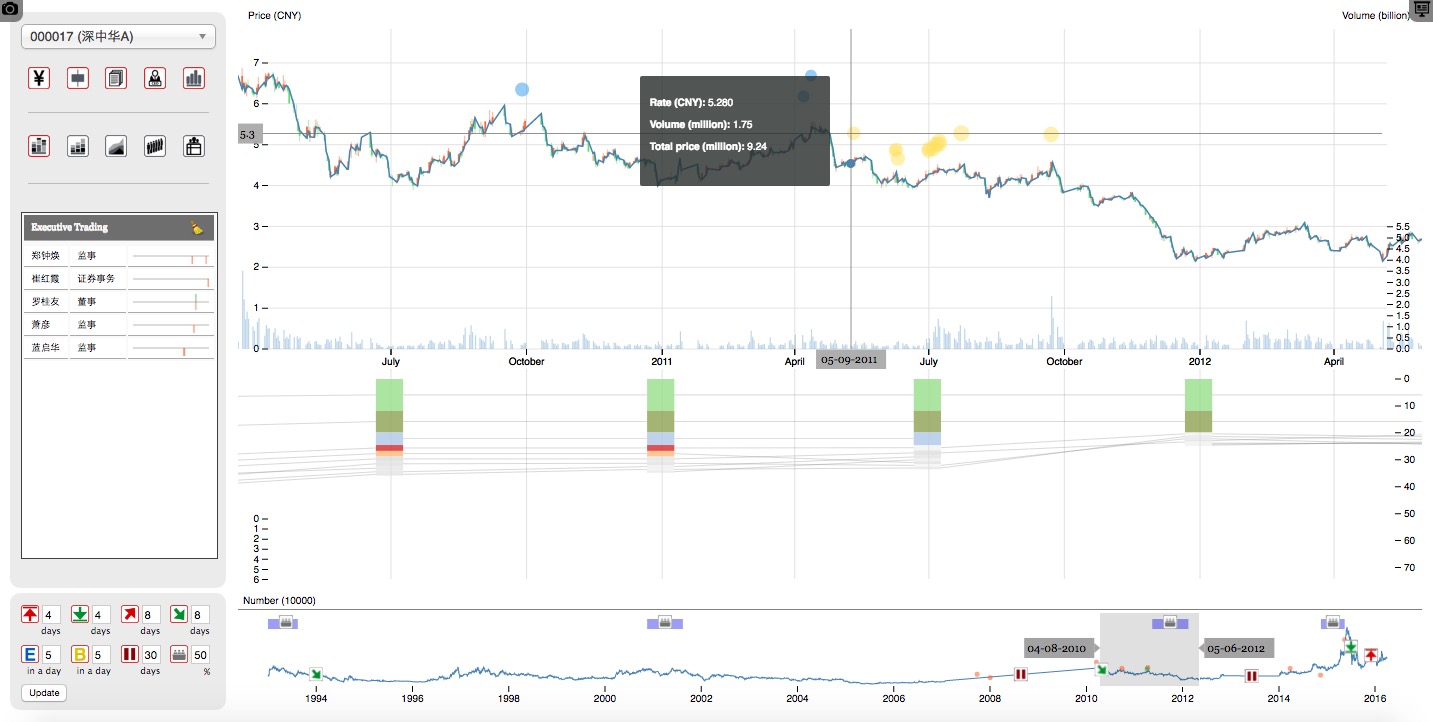
A time period selected
-
Add highlight boxes and annotations to the interface