

1/3
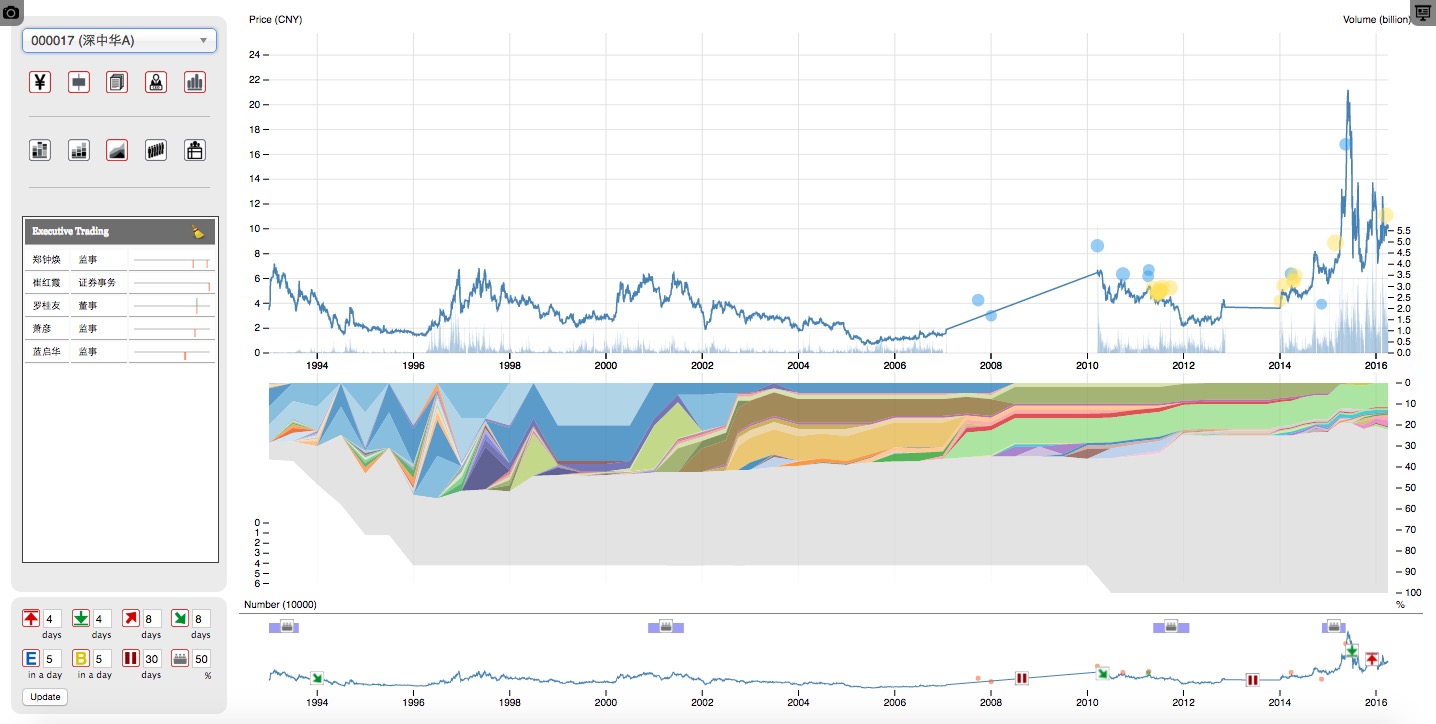
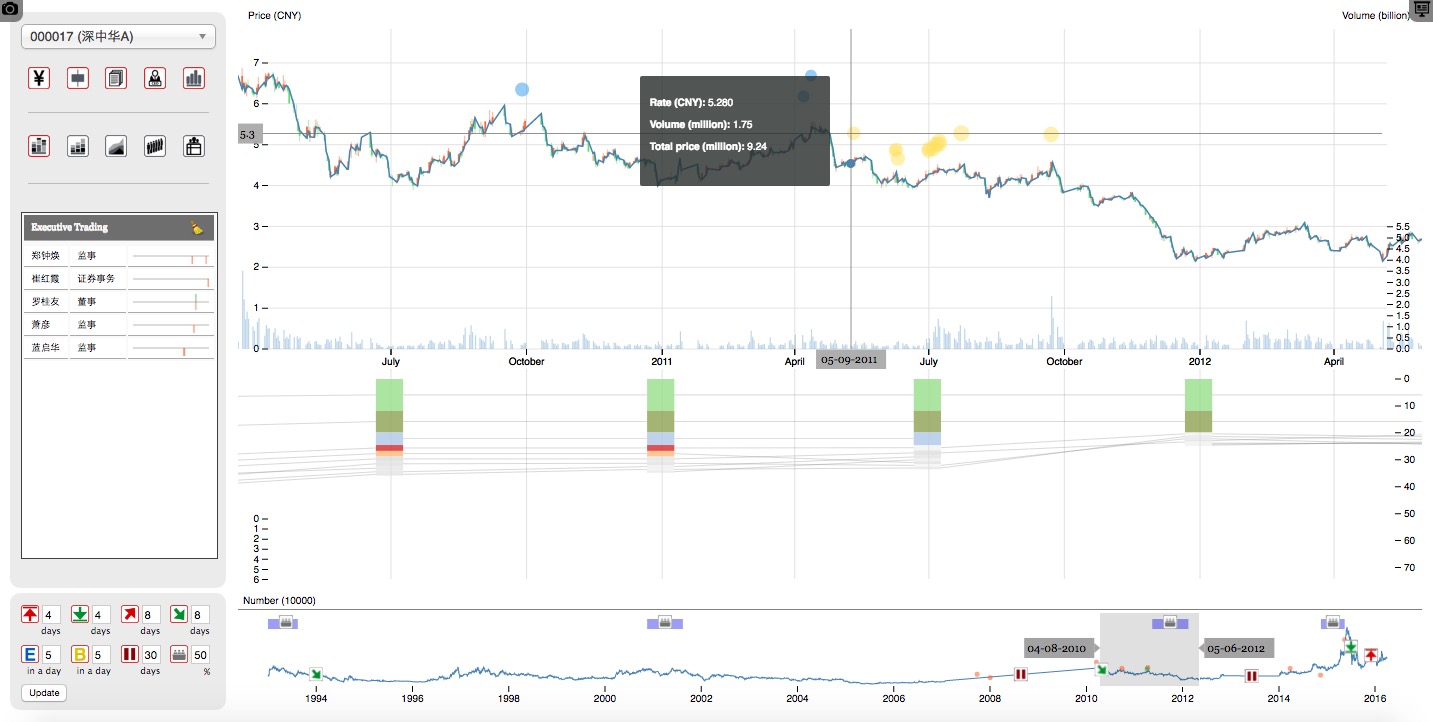
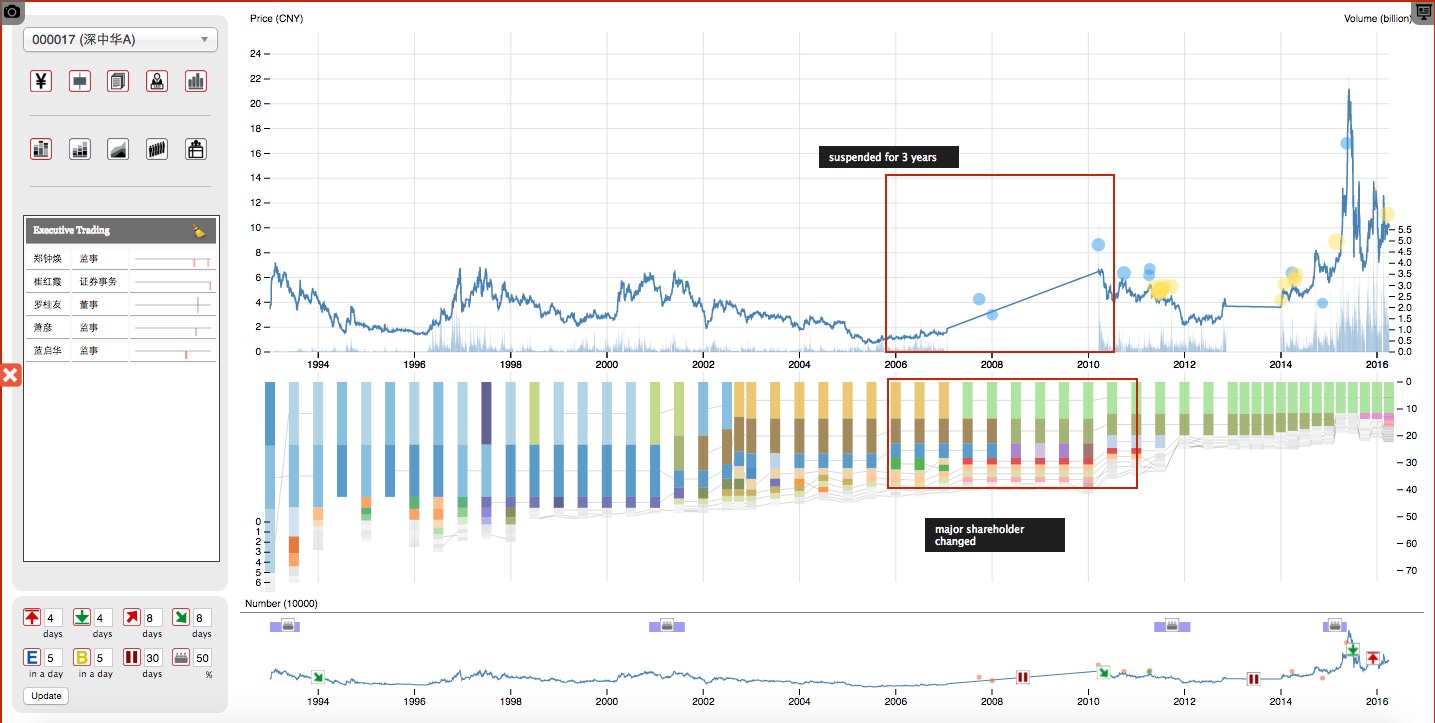
Visualization interfaces to help people make sense of the relationship between stock price and factors such as executive trading, major shareholder changes, block trades, and suspension of the stock.
Currently we focus on Chinese stock market.
Visualization interfaces to help people make sense of the relationship between stock price and factors such as executive trading, major shareholder changes, block trades, and suspension of the stock.
Currently we focus on Chinese stock market.